Contenders vs. Pretenders – The Structure of A Stanley Cup Champion

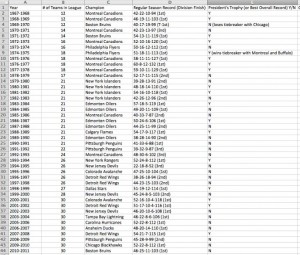
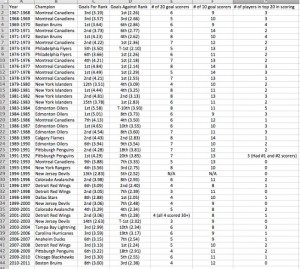
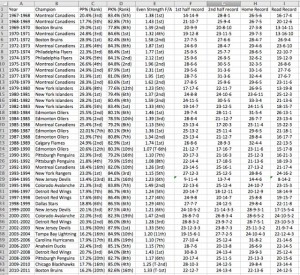
Every year at the beginning of the season, all the analysts make their predictions as to who will win the Stanley Cup. Come midseason, some reevaluate, some hang onto their original picks, and some have absolutely no clue due to the craziness of the NHL regular season. However, is there a predictor that can help us determine which team will win the Stanley Cup? Are there certain characteristics that a Stanley Cup champion has that other teams seem to lack? I went back to the 1967-1968 NHL season (the first season with more than the Original 6), to see if there were any characteristics that all of the Stanley Cup Champions seemed to have in common. I looked at almost every statistic that is available to us, from simple ones such as goals for and against, to even strength goals for vs. goals against, and the record in the 2nd half of the season. The results are posted in 3 separate Excel screen shots below
(Click to Enlarge the Images)
So after taking a quick gloss over those figures, who’s going to win the Cup? Well, it’s not that easy because injuries can always happen, a goalie can always get hot at the right time, and well, sometimes you need sheer dumb luck. But what we can do is see which of the teams this year most resemble these Stanley Cup Champions and maybe get a better of idea of who is truly a contender and which teams look good on the surface but are really pretenders.
These are the figures for the teams thus far (complete through all games played as of 1/21/2012).
We’ll take a run through each statistic now and award points to each team that meets the criteria of a Stanley Cup Champion.
1. Overall Win-Loss Record
No team has ever won the Stanley Cup while winning fewer than 38 games. Therefore, every team that is projected to win at least 38 games will receive 1 point. To account for the recent trend, every team projected to win 45 games or more will receive an additional point as the last team to win a Stanley Cup while winning fewer than 45 games was the 97-98 Detroit Red Wings – they won 44.
2. Goals For
Goals for has been a pretty strong indicator of success over the years. Just 4 of our champions have finished outside of the top 10 in goals for and none have been lower than 15th. Therefore, all teams in the top 10 will receive 1 point. To further delve in, of our 43 champions, 30 have been in the top 5, so the top 5 offenses will receive an additional 1 point.
3. Goals Against
Goals against has also been a pretty strong indicator of Stanley Cup success. Only 4 teams have finished outside of the top 10 in goals against, so all teams in the top 10 will receive 1 point. Again, to further jump in, 24 of our 43 Champions were in the top 5, so the top 5 defenses will receive an additional point. Another bonus point will be awarded if a team is top 10 in both goals against and goals for as 35 of our 43 champions were in the top 10 in both statistics.
4. # of 20 goal scorers
Come playoff time, your playmakers have to make plays and your goal scorers have to score goals and boy does it help when you have a plethora of guys that can do that. Only 2 teams have won the Stanley Cup with fewer than 4 20 goal scorers, so all teams with at least 4 projected 20 goal scorers will receive 1 point. Yes this is a difficult stat to measure midseason as a guy can get hot for his team and score a bunch of goals (a la Johan Franzen scoring 13 goals in March of 2008 for the Red Wings), but we’ll use what we know as of now. To account for the decrease in scoring over the years, we won’t further subdivide in this category.
5. # of 10 goal scorers
Again, having multiple guys that can score really helps. 32 of our 43 Champions had at least 10 guys score 10 goals for their teams so any team that is projected to have 10 or more 10 goal scorers will receive 1 point
6. PP%
This category is very tricky to evaluate. While a majority of our champions have had strong powerplays, the recent trend has been that the powerplay percentage does not matter as much. Why is that? Well for starters, we are at an all time low in penalty minutes called. Last season, the average NHL team had 291 powerplays (or about 3.5 a game). That figure was the lowest total since 1979-1980. This season, we are projected to have 293 powerplays per team so the powerplay really has lost its importance over the last few years. Thus for being strong on the powerplay, I will only award 0.5 points to the teams that are in the top 20 in powerplay % as only 1 franchise (94-95 Devils, 02-03 Devils) has won the Stanley Cup with a powerplay outside of the top 20.
7. PK%
Penalty Killing, unlike the powerplay has maintained its importance throughout the years despite the decrease in penalties called. That’s because with the decrease in scoring, it puts a significant amount of importance on killing off penalties because that 1 goal could be the difference. 1 point will be awarded to all teams in the top 15 in the NHL in PK% as well as an additional point be awarded if the team is in the top 10.
8. Even Strength F/A
This category is by far the most important today because of the increased amount of play at even strength. If you can’t win the battle at even strength, you will not win very many games in today’s game. Thus there will be several opportunities for teams to earn points in this category.
First – A point will be awarded if your team scores more than it gives up at even strength (Even Strength F/A > 1.00)
Second – To account for the adjustment in the game, if your team is in the top 10 in Even Strength F/A, you will be awarded a point (only 1 team in the last 43 years has won the Cup while being outside the top 10 and that was the 03-04 Lightning – they were 11th).
Third – If your team is in the top 5 in Even Strength F/A, you will be awarded 1 point as 34 of our 43 Champions were in the top 5 in Even Strength F/A
Fourth – If your team has an Even Strength F/A greater than 1.07 (the lowest number by any of our Champions – 89-90 Edmonton Oilers), your team will be awarded 1 point.
Fifth – If your team has an Even Strength F/A greater than 1.20 (35 of our 43 Champions had a figure greater than 1.20), your team will be awarded 1 point.
Sixth and Finally – If your team is 1st or 2nd in Even Strength F/A, your team will be awarded an additional point. More than half of our Champions were either 1st or 2nd in Even Strength F/A and last year’s finalists were 1 and 2, so the recent trend is there.
Let’s tally it up. There are 17.5 points possible. Who are our contenders?
1. Boston – 17.5
2. Detroit – 15.5
3. Vancouver – 12.5
4. New York Rangers – 12.0
5. Philadelphia – 10.5
6. St. Louis – 10.0
7. Pittsburgh – 9.5
8. San Jose – 8.5
9. Chicago – 7.5
10. Nashville – 6.5
So what are some of the surprises? First off, the Central Division has 4 teams in the top 10 Contenders which is downright impressive. Second, Boston earned a perfect score, nabbing all 17.5 points. We’ll have to see if that holds up for the entire season. Third, Chicago graded very poorly, and this is largely due to their abysmal defense, which is 18th overall in the NHL. It’s caused their Even Strength F/A to drop to 8th in the NHL and to 1.06, which is right on the cusp of being a contender. We’ll have to see if their even strength play improves over the 2nd half of the season. Well folks, there you have it. If I was a betting man, I’d probably look for a Detroit-Boston Finals. However, once the season ends, we’ll be able to add in # of scorers in the top 20, home record, road record, 1st half record, and 2nd half record to get an even better picture of our potential Stanley Cup Champion.
Full Standings Listed Below
Anaheim – 2.0
Boston – 17.5
Buffalo – 0.5
Calgary – 3.5
Carolina – 0.5
Chicago – 7.5
Colorado – 1.5
Columbus – 0.0
Dallas – 2.0
Detroit – 15.5
Edmonton – 1.5
Florida – 2.5
Los Angeles – 5.0
Minnesota – 3.0
Montreal – 4.0
Nashville – 6.5
New Jersey – 5.0
NY Islanders – 3.5
NY Rangers – 12.0
Ottawa – 5.5
Philadelphia – 10.5
Phoenix – 3.0
Pittsburgh – 9.5
San Jose – 8.5
St. Louis – 10.0
Tampa Bay – 1.0
Toronto – 4.5
Vancouver – 12.5
Washington – 3.5
Winnipeg – 3.5

