Best & Worst Cities for Hockey Fans in 2015
Believe it or not, hockey is becoming more popular in North America, specifically the states. Ticket prices are going up yearly along with such things as beer prices and other commodities that can be purchased at your team’s arena. It’s a love-hate type of relationship for most of us; our wallets get thinner but our love for the game only grows deeper season by season regardless of the cost we choose to accrue.
Thanks to WalletHub, we have a sense to see how some of the best and worst locations (specifically cities) have done in 2015 to welcome the game of hockey. Below are some of the findings in the report:
|
Overall Rank |
City |
“Teams & Performance” Rank |
“Costs & Fan Engagement” Rank |
|---|---|---|---|
| 1 | Pittsburgh, PA | 8 | 7 |
| 2 | Chestnut Hill, MA | 7 | 3 |
| 3 | St. Louis, MO | 18 | 6 |
| 4 | Tampa, FL | 34 | 4 |
| 5 | Boston, MA | 1 | 40 |
| 6 | St. Paul, MN | 28 | 10 |
| 7 | Detroit, MI | 9 | 17 |
| 8 | Denver, CO | 2 | 35 |
| 9 | Chicago, IL | 3 | 25 |
| 10 | Anaheim, CA | 11 | 18 |
| 11 | Hamilton, NY | 39 | 2 |
| 12 | Big Rapids, MI | 36 | 5 |
| 13 | Buffalo, NY | 16 | 21 |
| 14 | East Lansing, MI | 40 | 9 |
| 15 | Sunrise, FL | 60 | 11 |
| 16 | Newark, NJ | 23 | 22 |
| 17 | Glendale, AZ | 61 | 11 |
| 18 | Bowling Green, OH | 27 | 20 |
| 19 | Durham, NH | 29 | 16 |
| 20 | Washington, DC | 22 | 23 |
| 21 | Houghton, MI | 21 | 24 |
| 22 | San Jose, CA | 20 | 28 |
| 23 | Carnot-Moon, PA | 38 | 13 |
| 24 | Ann Arbor, MI | 10 | 48 |
| 25 | Oxford, OH | 25 | 26 |
| 26 | New York, NY | 4 | 38 |
| 27 | Dallas, TX | 26 | 31 |
| 28 | Grand Forks, ND | 6 | 52 |
| 29 | Canton, NY | 45 | 14 |
| 30 | Philadelphia, PA | 12 | 36 |
| 31 | Hanover, NH | 64 | 8 |
| 32 | University Park, PA | 54 | 15 |
| 33 | Los Angeles, CA | 14 | 39 |
| 34 | Raleigh, NC | 49 | 29 |
| 35 | Mankato, MN | 15 | 47 |
| 36 | Columbus, OH | 17 | 41 |
| 37 | Ithaca, NY | 32 | 37 |
| 38 | Marquette, MI | 55 | 19 |
| 39 | Sault Ste. Marie, MI | 47 | 32 |
| 40 | Hamden, CT | 24 | 50 |
| 41 | Orono, ME | 52 | 30 |
| 42 | Nashville, TN | 53 | 34 |
| 43 | South Bend, IN | 36 | 44 |
| 44 | Madison, WI | 35 | 45 |
| 45 | Minneapolis, MN | 5 | 65 |
| 46 | West Point, NY | 71 | 1 |
| 47 | Schenectady, NY | 13 | 59 |
| 48 | Burlington, VT | 50 | 49 |
| 49 | Niagara Falls, NY | 59 | 42 |
| 50 | Fairbanks, AK | 48 | 51 |
| 51 | Bemidji, MN | 69 | 33 |
| 52 | Potsdam, NY | 63 | 43 |
| 53 | Andover, MA | 66 | 27 |
| 54 | New Haven, CT | 19 | 65 |
| 55 | Kalamazoo, MI | 57 | 53 |
| 56 | Colorado Springs, CO | 42 | 57 |
| 57 | Rochester, NY | 55 | 54 |
| 58 | Omaha, NE | 50 | 56 |
| 59 | Amherst, MA | 68 | 46 |
| 60 | Troy, NY | 44 | 60 |
| T-61 | Providence, RI | 41 | 64 |
| T-61 | St. Cloud, MN | 31 | 67 |
| 63 | Worcester, MA | 58 | 58 |
| 64 | Lowell, MA | 30 | 68 |
| 65 | Waltham, MA | 62 | 62 |
| 66 | Erie, PA | 46 | 69 |
| 67 | Duluth, MN | 33 | 70 |
| 68 | Hartford, CT | 65 | 63 |
| 69 | Princeton, NJ | 74 | 54 |
| 70 | Huntsville, AL | 67 | 61 |
| 71 | Cambridge, MA | 42 | 73 |
| 72 | Fairfield, CT | 73 | 72 |
| 73 | Anchorage, AK | 70 | 71 |
| 74 | Springfield, MA | 72 | 74 |
Remember that the above locations also factor in AHL and college hockey (NCAA) teams.
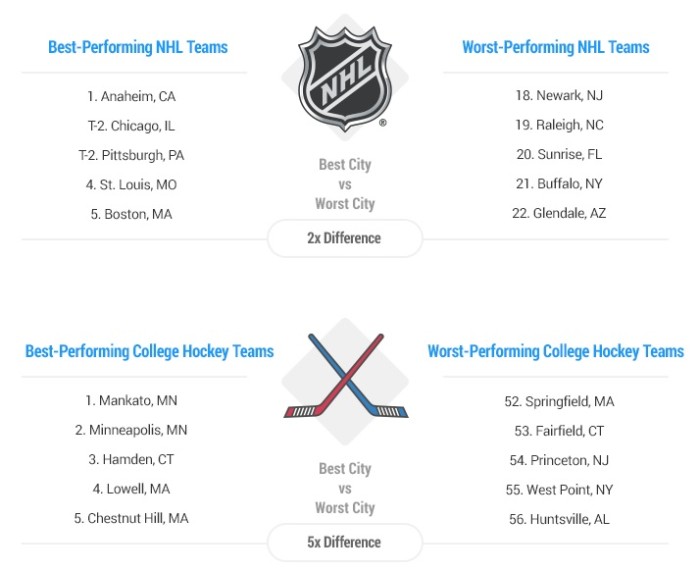
We know there has been quite a feud the recent years between Los Angeles Kings and Anaheim Ducks fans. Some chirps directed at fans of the Ducks was in their success overall which is hard to argue when you’re #1 for performance in this study as seen above.
Any surprise here? Perhaps below might be a little more interesting.
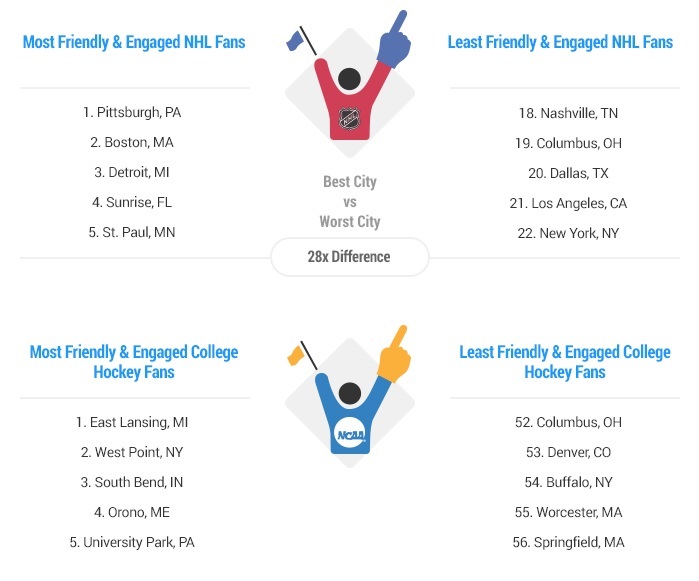
It’s no secret that a hockey fan will always believe his or her team has the best and most friendliest fans in the entire league. However, we don’t have anymore ties in hockey (NHL) therefore someone has to be #1 for this study.
Like the findings or hate what you just saw?
Remember that WalletHub set a guideline for how they went about determining these cities and you can see more on the criteria there.
To find the best and worst cities for professional- and college-hockey fans, WalletHub analyzed 74 of the most populated U.S. cities with at least one NHL or NCAA Division I hockey team. They were measured across two equally weighted key dimensions, including “Teams & Performance” and “Costs & Fan Engagement.” We then identified 18 relevant metrics, which are listed below with their corresponding weights.
