Hit or Miss-Do Size and Physicality Bring Wins?

Whenever I come down from college – back to the kindly, warm glow of home and civilization in general – I’m greeted with open arms by my parents, my kid brother, my girlfriend, and friends that haven’t left the state. Without fail, Papa Lopes and I will sit down in the living room and watch some TV. Without fail, I’ll hijack the remote control and switch the channel to Fox Sports Florida whenever the Panthers are on. And without fail, this conversation always pops up:
- *Cue Panthers Player X not annihilating Opposition Player Y as he enters the offensive zone*
- Dad: “WHAT ARE YOU DOING??? HIT THE GUY!”
- Me: “But dad, what if he misses? The dude’s in on net!”
- Dad: “It’s not like we can stop anything anyway!”
- Me: “Ain’t it better than having an odd-man rush?!”
- Dad: “Listen, if you hit the guy, he won’t be in, will he?”
- Me: “And if he doesn’t?”
- Dad: “I don’t know what’s going on, but the Panthers need to hit more. Old-time hockey. None of this prissy, bump-him-along-the-endboard bulls***.”
- *Exit stage left. Cue curtains*
Granted, neither of us have any experience playing organized hockey, with the extent of my knowledge culled from the Internet, live games, and EA Sports’s NHL series, editions 11-13. Along with typical commentary on goals, dekes, and the like, our previous discussion represents the sum total of our dialogue, ideological sparring from two (perhaps poorly represented) schools of thought. The debate exists throughout all three zones, permeating the forecheck and the penalty kill alike. Much has been made about size’s impact in today’s game, but the question remains: does it translate to on-ice success?
For the sake of argument, I’ll be comparing fourth lines, forward combinations typically looked at for size, sandpaper grit, defensive responsibility, and the occasional spark of energy. It’s generally held that teams possessing organizational depth realize greater success than their stratified counterparts; in taking this extreme case, I’m seeking a correlation between team success and either hits or secondary scoring produced by said lines. Perhaps a link exists connecting both. Who knows?
In defining general information (stats provided by Yahoo! Sports), the following chart sorts teams by average height and lists the following:
- Team name (overall league standing given in parenthesis)
- Most recent fourth-line combination (per The Daily Faceoff) and combined games played
- Average height and weight of said line
- Total hits
- Total PIMs
| Team (pos) | Line (total games played) | Avg. Ht.(inches) | Avg. Wt.(pounds) | Tot. Hits | Tot. PIM |
| WPG (20) | Eric Tangradi, James Wright, Anthony Peluso (87) | 75.67 | 218.67 | 138 | 46 |
| COL (10) | Patrick Bordeleau, Marc-Andre Cliché, Cody McLeod (100) | 74.67 | 212.33 | 134 | 135 |
| VAN (9) | Tom Sestito, Zac Dalpe, Dale Weise (87) | 74.67 | 211.00 | 121 | 106 |
| FLA (27) | Scott Gomez, Drew Shore, Jimmy Hayes (43) | 74.67 | 206.33 | 55 | 22 |
| WSH (16) | Aaron Volpatti, Jay Beagle, Tom Wilson (86) | 74.33 | 213.33 | 174 | 126 |
| NYR (24) | Brian Boyle, Dominic Moore, Derek Dorsett (104) | 74.33 | 209.33 | 172 | 149 |
| CGY (26) | Lance Bouma, Sean Monahan, Brian McGrattan (101) | 74.33 | 210.00 | 123 | 61 |
| NSH (23) | Eric Nystrom, Paul Gaustad, Matt Hendricks (110) | 74.00 | 209.00 | 213 | 111 |
| LOS (7) | Kyle Clifford, Colin Fraser, Jordan Nolan (82) | 74.00 | 207.33 | 173 | 96 |
| BUF (30) | Linus Omark, Matt Ellis, John Scott (28) | 74.00 | 218.00 | 42 | 48 |
| ANA (1) | Patrick Maroon, Nick Bonino, Jakob Silfverberg (79) | 73.67 | 208.67 | 62 | 44 |
| STL (4) | Dmitrij Jaskin, Chris Porter, Adam Cracknell (23) | 73.67 | 204.00 | 43 | 0 |
| NYI (29) | Colin McDonald, Casey Cizikas, Matt Martin (104) | 73.33 | 203.00 | 331 | 72 |
| BOS (6) | Daniel Paille, Gregory Campbell, Jordan Caron (92) | 73.33 | 200.33 | 136 | 45 |
| CBJ (22) | Boone Jenner, Ryan Craig, Corey Tropp (44) | 73.33 | 204.33 | 102 | 29 |
| TOR (17) | Jerry D’Amigo, Peter Holland, Colton Orr (58) | 73.33 | 208.67 | 100 | 85 |
| CHI (2) | Brandon Bollig, Marcus Kruger, Ben Smith (116) | 73.00 | 203.67 | 113 | 81 |
| MON (11) | Brandon Prust, Ryan White, Travis Moen (92) | 72.67 | 201.67 | 140 | 94 |
| EDM (28) | Luke Gazdic, Anton Lander, Nail Yakupov (83) | 72.67 | 203.67 | 103 | 106 |
| TB (8) | Richard Panik, Tom Pyatt, B.J Crombeen (68) | 72.67 | 201.67 | 81 | 66 |
| CAR (25) | Radek Dvorak, Manny Malhotra, Zach Boychuk (60) | 72.67 | 200.00 | 47 | 30 |
| PIT (3) | Tanner Glass, Zach Sill, Craig Adams (78) | 72.33 | 204.00 | 220 | 84 |
| SJ (5) | James Sheppard, Andrew Desjardins, Mike Brown (86) | 72.33 | 204.00 | 130 | 99 |
| PHO (12) | Kyle Chipchura, Jeff Halpern, Gilbert Brule (67) | 72.33 | 193.00 | 63 | 42 |
| OTT (21) | Matt Kassian, Jean-Gabriel Pageau, Erik Condra (70) | 72.33 | 201.67 | 62 | 44 |
| PHI (18) | Steve Downie, Adam Hall, Zac Rinaldo (95) | 72.00 | 190.67 | 177 | 134 |
| MIN (14) | Stephane Veilleux, Zenon Konopka, Torrey Mitchell (85) | 72.00 | 200.67 | 62 | 69 |
| DET (13) | Danny Cleary, Luke Glendening, Gustav Nyquist (70) | 71.33 | 196.00 | 61 | 26 |
| DAL (15) | Shawn Horcoff, Vernon Fiddler, Ray Whitney (100) | 71.33 | 198.33 | 56 | 48 |
| NJD (19) | Reid Boucher, Andrei Loktionov, Cam Janssen (69) | 71.00 | 200.00 | 60 | 28 |
At first glance, size – strictly in terms of height – doesn’t appear to factor much into the big picture; you’d have to drop to #11 on the height-sorted list to encounter your first top-five team (the league-leading Anaheim Ducks). Of the ten teams sporting the largest lines, lines that ought to shield the puck better and stand their ground in the corners, seven occupy the bottom half of overall league standings. Weight suffers from much of the same; yet again, seven of the top-ten heaviest teams fall in the bottom half.
Shifting gears, a little more than half of the teams (nine) in the top half of the average height column infiltrate the top half of our total hits section. Conversely, fewer than half of said teams (six) place in the top-15 in total PIMs. (I can’t believe I just spent 12 hours making spreadsheets and eating Cuban food just to pelt you with that cliche about the size of the fight in the proverbial dog holding de facto prominence in the grand discussion.)

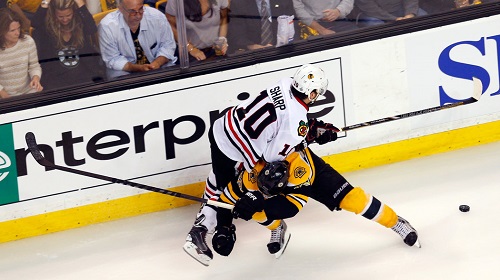
(Photo by Jonathan Daniel/Getty Images)
But pausing at this superficial level does us no good. The following chart (statistics courtesy of Extra Skater) delves a bit deeper, depicting a team’s offensive production. Sorted by points, lines are further measured by:
- Total goals produced
- Total plus-minus
- Average Corsi For percentage
- Offensive zone starts divided by the sum of offensive and defensive zone starts at even strength (an advanced metric for measuring how sheltered a player is; rather, the security of his zone starts. A higher percentage indicates a higher percentage of offensive zone starts, therefore indicating a player receives more favorable, “sheltered” starts)
| Team (pos) | Line (total games played) | Tot. Goals | Tot. Points | Tot. +/- | Avg. CF% | Avg. O/DSt% |
| ANA (1) | Patrick Maroon, Nick Bonino, Jakob Silfverberg (79) | 17 | 39 | 10 | 51.07 | 49.83 |
| CHI (2) | Brandon Bollig, Marcus Kruger, Ben Smith (116) | 11 | 36 | 8 | 48.93 | 20.57 |
| DAL (15) | Shawn Horcoff, Vernon Fiddler, Ray Whitney (100) | 10 | 34 | -4 | 48.90 | 51.47 |
| CGY (26) | Lance Bouma, Sean Monahan, Brian McGrattan (101) | 13 | 25 | -9 | 39.47 | 51.40 |
| NSH (23) | Eric Nystrom, Paul Gaustad, Matt Hendricks (110) | 13 | 18 | -22 | 42.27 | 37.70 |
| COL (10) | Patrick Bordeleau, Marc-Andre Cliché, Cody McLeod (100) | 6 | 17 | 10 | 41.03 | 55.10 |
| NYI (29) | Colin McDonald, Casey Cizikas, Matt Martin (104) | 8 | 17 | -18 | 42.80 | 41.43 |
| NYR (24) | Brian Boyle, Dominic Moore, Derek Dorsett (104) | 5 | 17 | -14 | 48.20 | 27.63 |
| DET (13) | Danny Cleary, Luke Glendening, Gustav Nyquist (70) | 8 | 16 | -9 | 49.37 | 57.27 |
| EDM (28) | Luke Gazdic, Anton Lander, Nail Yakupov (83) | 7 | 16 | -29 | 40.57 | 49.30 |
| TB (8) | Richard Panik, Tom Pyatt, B.J Crombeen (68) | 2 | 15 | -5 | 49.53 | 49.23 |
| SJ (5) | James Sheppard, Andrew Desjardins, Mike Brown (86) | 4 | 15 | -11 | 49.23 | 45.23 |
| PHI (18) | Steve Downie, Adam Hall, Zac Rinaldo (95) | 3 | 15 | -13 | 48.07 | 38.57 |
| MON (11) | Brandon Prust, Ryan White, Travis Moen (92) | 4 | 15 | -7 | 44.43 | 38.40 |
| NJD (19) | Reid Boucher, Andrei Loktionov, Cam Janssen (69) | 7 | 14 | 3 | 54.07 | 62.90 |
| LOS (7) | Kyle Clifford, Colin Fraser, Jordan Nolan (82) | 8 | 14 | 4 | 54.40 | 57.70 |
| BOS (6) | Daniel Paille, Gregory Campbell, Jordan Caron (92) | 7 | 13 | -6 | 45.33 | 43.17 |
| VAN (9) | Tom Sestito, Zac Dalpe, Dale Weise (87) | 5 | 12 | -14 | 41.20 | 38.00 |
| PHO (12) | Kyle Chipchura, Jeff Halpern, Gilbert Brule (67) | 3 | 11 | -15 | 47.90 | 52.53 |
| CBJ (22) | Boone Jenner, Ryan Craig, Corey Tropp (44) | 5 | 11 | 3 | 42.33 | 50.13 |
| TOR (17) | Jerry D’Amigo, Peter Holland, Colton Orr (58) | 6 | 11 | -2 | 42.00 | 45.20 |
| PIT (3) | Tanner Glass, Zach Sill, Craig Adams (78) | 5 | 11 | -10 | 43.70 | 39.10 |
| CAR (25) | Radek Dvorak, Manny Malhotra, Zach Boychuk (60) | 4 | 11 | 11 | 44.57 | 33.83 |
| OTT (21) | Matt Kassian, Jean-Gabriel Pageau, Erik Condra (70) | 5 | 10 | -7 | 50.27 | 54.53 |
| FLA (27) | Scott Gomez, Drew Shore, Jimmy Hayes (43) | 5 | 10 | -9 | 48.50 | 45.07 |
| MIN (14) | Stephane Veilleux, Zenon Konopka, Torrey Mitchell (85) | 3 | 10 | -13 | 47.00 | 33.53 |
| WSH (16) | Aaron Volpatti, Jay Beagle, Tom Wilson (86) | 3 | 7 | -4 | 41.07 | 53.53 |
| WPG (20) | Eric Tangradi, James Wright, Anthony Peluso (87) | 2 | 6 | -8 | 48.97 | 54.50 |
| STL (4) | Dmitrij Jaskin, Chris Porter, Adam Cracknell (23) | 1 | 4 | 3 | 53.83 | 53.63 |
| BUF (30) | Linus Omark, Matt Ellis, John Scott (28) | 2 | 3 | -9 | 42.77 | 44.53 |
Only five squads managed Corsi For marks above the break-even 50% line. Of those five, three inhabit the league’s top ten in Corsi For. And of those three, only the Los Angeles Kings cracked the top ten in terms of height. As an aid in driving puck possession, height plays a negligible role; the Winnipeg Jets‘ towering fourth line, tops in average height, places ninth in Corsi rankings. Jimmy Hayes and company, representatives of the Florida Panthers, placed twelfth in said category, all the while rating second in height. In fact, only three teams that are in the top five in average height place in the top-half of Corsi standings.
Note the curious case of the Chicago Blackhawks‘ trio of Marcus Kruger, Brandon Bollig and Ben Smith. Placing in the bottom half in both average height and weight (17th overall), they are among the elite in terms of bottom-line scoring, combining for a total of 36 points, just three behind Jakob Silfverberg and his Anaheim Ducks compatriots. What’s even more stunning is that the Blackhawks’ fourth line lead ALL players, both elite and otherwise, in terms of the fewest “sheltered starts” (or starts in the offensive end), and at a cumulative plus-eight, they rank fourth among all combinations in our study.
Granted, these figures paint only a small picture, denoting the intangible attributes of a meager quarter of a team’s forward core. Also, certain lines may be afflicted by injury, forcing teams to plug in healthy scratches or AHL call-ups. Furthermore, all figures are unweighted, not accounting for quality of competition or average ice-time. As it would appear in my imperfect spreadsheet (give me a break, I’ve been doing this for eight hours at least and I can sort of use Excel), height and weight don’t seem to guarantee physicality, or secure points to boot. But don’t take my word for it; in a recent article of his, NHL Number‘s Byron Bader composed a graph, sorting teams by height and adjusting the figures for ice-time. The results paint a similar picture; quoth Bader,
“The main thing that comes out is having above average skilled big players is not predictive of overall team success. In fact, the split is right down the middle. Half of the best teams are in the tall range and the other half of the best teams are in the shorter range. Interestingly, the Sabres are the tallest team in the league, based on their deployment, but are the lanslide (sic) winners for worst team this year. The Jets, the runner-ups for the tallest team, are a little better than the Sabres but not an elite team by any stretch”
What I guess I’ve been getting at over the last 1,545 words is that size, while nice to have, isn’t the end-all-be-all when speaking of grit. Surely it helps, but only to a degree. Like all else in life, any attribute, inherent or otherwise, remains cuffed until properly utilized. Size on its own doesn’t spell out success. As a product of a system, however, it contributes to the ultimate goal. Flying across a rink and ramming into anything with a pulse doesn’t lead to victories. While it makes the fans roar and the dormant savage in me giddy at the sight, hitting ought not be a priority. Play the puck, not the man. Bodies will fly after all.

